At its core, a survey is a method used to collect data from a subset of a population to draw conclusions or make inferences about the entire population. They’re often used in research, market studies, political polling, and many other fields to gauge opinions, behaviors, or characteristics. But how to distinguish between a good or a bad survey?

The Pillar of Methodology
Methodology is the backbone of a survey. It dictates how data is collected, from whom, and how it’s analyzed. A sound methodology ensures that survey results are a true reflection of the population. Conversely, a poor methodology can lead to misleading or skewed results.
How most media outlets are failing us in reporting a bad survey
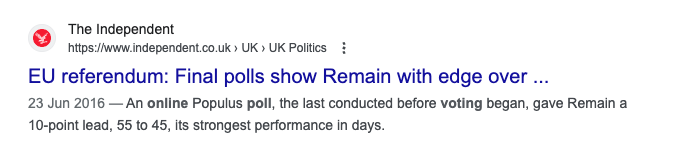
Recently, there’s been a trend in the media where headlines are driven by catchy survey results without delving into the methodology behind them. In today’s fast-paced digital age, headlines are crafted to grab attention and drive clicks.
However, this emphasis on “clickability” can sometimes overshadow the accuracy and reliability of the content. To the casual reader, such a headline might seem indicative of the larger public sentiment. But without a solid understanding of the survey’s methodology, it’s impossible to gauge the veracity of the claim. It’s essential for media outlets to question and scrutinize the methods used before presenting survey results to the public.
How to spot poor methodologies
One can start off by scrapping online surveys from the get go especially for politically sensitive polling. While convenient and cost-effective, they come with a host of potential pitfalls, which more often than not do not present a true picture as these create avenues for sample bias. Sample or selection bias refers to the systematic error introduced into research or data analysis when the participants included in the study (or the data selected for analysis) are not truly representative of the intended population. This can lead to conclusions that are not generalizable to the broader population.
Who participated in the survey?
The survey was carried out online with respondents who opted in voluntarily after seeing advertisements on social media platforms. This method is inherently prone to selection bias. People who are motivated to click on a survey advertisement and complete it might have strong opinions or might belong to certain demographic or interest groups, leading to a non-representative sample.
Online advertisements
Online ads might only reach those active on social media or more likely to click on ads. This method can exclude large segments of the population, further distorting the survey’s representativeness.
For example, people who are in manual labour jobs have less access to social media than professionals sitting on a desk.
Potential for multiple entries:
Online surveys, depending on how they are administered, might allow for the same person to take the survey multiple times. Even with IP tracking or other measures, dedicated individuals can use VPNs or other methods to skew results.
Adjusting results after collection
Making adjustments or “weighting” survey results post-collection can be a way to correct for certain imbalances in the sample. However, it’s always preferable to ensure a representative sample during the data collection stage for several compelling reasons:
Compounding Assumptions
By adjusting after collection, we assume that the responses from the initial respondents are reflective of the larger subgroup they’re meant to represent. For instance, if only one 20-year-old is surveyed, but the actual population representation requires 10 such respondents, simply multiplying the single response assumes that this one individual’s views are representative of all 20-year-olds. This is a gross oversimplification and can lead to skewed results.
Loses the Essence of Random Sampling
The beauty of a truly random sample is that it should naturally reflect the broader population. By relying heavily on post-survey adjustments, we move further away from this foundational principle.
The Gold Standard: Telephone Surveys with a Sample of 600
Though no survey method is infallible, telephone surveys with a stratified sample of around 600 participants tend to be more reliable:
- Random Digit Dialing: Captures a wide range of the population, including those without internet.
- Live Interviewers: They help clarify questions, leading to more accurate answers.
- Reduces Self-reporting Errors: Interacting with a live interviewer can elicit more honest responses.
- Sampling done beforehand: It’s essential to ensure the data is representative from the start, rather than making adjustments afterward.
- Efficient and Economical: A well-structured survey with 600 participants can achieve a margin of error close to 4%, which is acceptable for most research needs.
Stratified sampling divides a population into subgroups and samples from each. For example, in a school survey, students could be stratified by grade, and then a random sample from each grade is taken to represent the entire school.
Leave a Reply